Installation
I'm going to assume that you already use Chrome, and that you're confident developing in browser using the incredible dev tools that come with Chrome. First, you need to install the AngularJs Batarang from the Chrome extension gallery. If you've not done this before there's a big green button towards the top right of the modal that details the extension. It's a good idea to restart your browser at this point. It's been a while since I've installed this, but I seem to remember that extensions for dev tools nearly always need a browser restart before they work properly.On the extension page you'll also see a video on how to use the features of the Batarang, that may make this post redundant. I don't remember that being there when I first installed it. I'm going to talk about the two features I use the most in hope that provides some value to you.
There are three parts to the Batarang, but I really only use the property explorer and the console functionality.
Property Explorer
You'll now see that in the same panel that you can see your styling you now have an extra tab labelled AngularJs Properties. You may find it in the double chevron dropdown if you don't have this pane wide enough to show all tabs, but it will be there somewhere.
Console
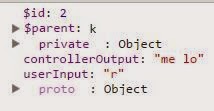
This feature I tend to use in order to run AngularJs statements on the DOM to see what would happen before I add the code to my solution. This is probably symptomatic of my age and when I started web developing. I love writing code in the browser due to how instant it feels. I find it especially useful when I'm demonstrating code to non-technical colleagues and they want to know if a change is possible and / or see it in action.As with the property explorer, the console runs the statements that you give it in the context of the element you have selected in the Elements tab in the main pane. It's worth noting, that you need to fully qualify any statement or variable call. For instance, if you have a property
foo hanging off $scope you will need to write $scope.foo.
No comments:
Post a Comment